
Funding bodies, government partners and investors increasingly want proof — not just that people are participating, but that your programs are reaching the communities they care about most. Community Reach gives you that proof.
By connecting your participation and membership data with granular community population datasets, Community Reach delivers a joined-up view across every place, space and activity, showing who you’re reaching, who you’re not, and where the evidence points for growth, inclusion and investment.
The video below walks through Community Reach using a sport-focused demo, but the insights and capabilities apply equally to facilities and clubs.
Community Reach sits within the ActiveXchange platform and connects participation and membership data with granular community population datasets. It delivers a consistent, joined-up view across places, spaces, and activities – showing which groups are engaged, which are underserved, and where opportunities exist to increase equity and inclusion.
Community Reach profiles current and recent participants alongside community populations across six key lenses:
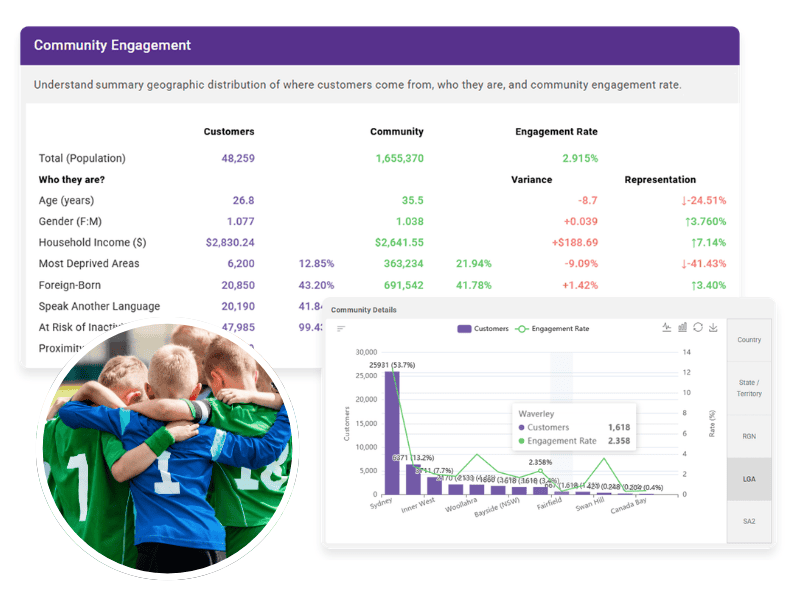
The starting point is a scorecard that compares your membership or participant numbers against the population living within a set drive time of your sporting venues and facilities. Drive time is fully adjustable, which is particularly useful when comparing metro and regional locations, where travel habits differ significantly. The scorecard surfaces key indicators including age, gender, median household income, deprivation areas, cultural background, and languages spoken at home – all benchmarked against the local community population.
Beyond standard demographics, Community Reach integrates third-party household segmentation data. ActiveXchange appends thousands variables to your membership base and local population, grouping people into one of many community segments that reflect their habits, attitudes, interests, and lifestyle. Where a segment is well-represented in the population but underrepresented in your membership, that signals a potential growth opportunity or a barrier worth investigating. Help text and hyperlinks throughout the dashboard provide more detail on each segment profile.
A dedicated demographic breakdown covers age, gender, household income, cultural background, and languages spoken at home – all compared against the local catchment population. This highlights both underrepresented groups and areas of strong engagement to guide ED&I strategies.
This displays where members or participants are travelling from at a suburb level or filtered by Local Government Area (LGA). This provides insights into drive-time travel patterns, urban versus regional spread, and levels of socio-economic deprivation, helping to pinpoint areas of low engagement and inform investment and programming decisions.
Community Reach assesses health and lifestyle influences within your customer or member base (including inactivity risk and wellbeing indicators) and compares these against the broader community. This helps identify where services can make the greatest social impact.
Engagement trends including membership duration, registration patterns, customer lifetime value, and popular membership types are tracked to identify behaviours that drive loyalty versus areas of churn.
Community Reach is built to answer the questions that funders, government partners and boards are increasingly asking, and to give your team the evidence to respond with confidence.
Having this data in one place means you can move from gut feel to evidence in the conversations that matter most.
Subscribe now to keep reading and get access to the full archive.